How much food is entering the Gaza Strip? This question has been the subject of much discussion, and even more misinformation, given the political significance of the answer. South Africa, for example, tried to use claims of a “famine” in Gaza at the International Court of Justice to try and force Israel, by judicial decree, to halt its operation to defeat Hamas and rescue the hostages.
It’s thus critically important that journalists covering this question are careful with the facts. Unfortunately, a recent CNN piece falls short in this regard. An April 17 article by Tamar Michaelis, Tim Lister, and Kareem Khadder, entitled “Israel again accuses UN of “excuses” on aid for Gaza — but UN says deliveries facing major checkpoint delays,” errs by presenting inaccurate data alongside misleading data to advance a narrative.
The errors can be found in a graphic supposedly depicting the daily average number of aid trucks entering the Gaza Strip both before and after October 7.
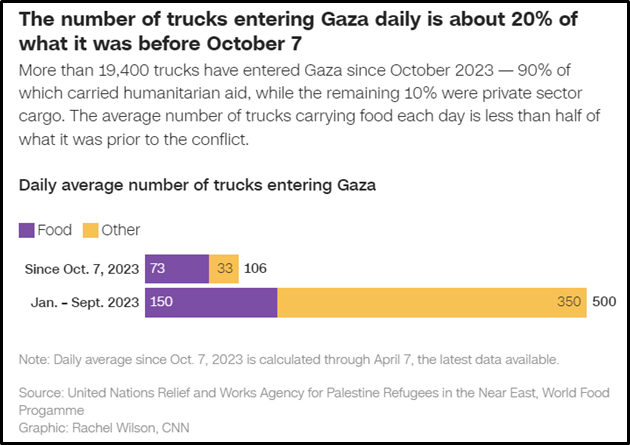
A screenshot of the graphic included in the CNN article.
The graphic, and the preceding text, suggest that the daily average number of trucks bringing food into Gaza now (73) is less than half of what it was before October 7 (150).
In fact, the truth is precisely the opposite. Substantially more trucks are bringing food into Gaza today than were a year ago.
As will be detailed below, the pre-war figure of 150 average daily trucks is unsupported by the actual data, and the real figure is about half that number. Meanwhile, the figure for trucks after October 7 is seriously misleading in that it dramatically understates the number of trucks currently bringing food into Gaza.
Inaccurate Pre-War Data
The CNN graphic cites as its sources UNRWA and the World Food Programme. However, the only source this author could track down for the figure of 150 average daily trucks during the first nine months of 2023 is a report by an organization called the IPC Global Initiative, affiliated with a handful of UN and other aid agencies.
The report claims, “Between January and September 2023, a daily average of 150 food trucks entered the Gaza Strip. Between 8 October 2023 and 9 March 2024, this number decreased to an average of 65 trucks per day.”
But there’s a problem with this. The IPC report provides no source or evidence for this figure. In fact, the source referenced in the footnote for the sentence quoted above contains only information about the flow of aid trucks after October 7, not before.
Worse, the figure cited by CNN and the IPC is contradicted by data provided by the main UN agency tasked with tracking such information, the UN Office for the Coordination of Humanitarian Affairs (OCHA).
According to OCHA’s database, the average daily number of trucks bringing “human food products” into Gaza during the first nine months of 2023 was 75.3, about half the figure provided by the IPC and CNN.
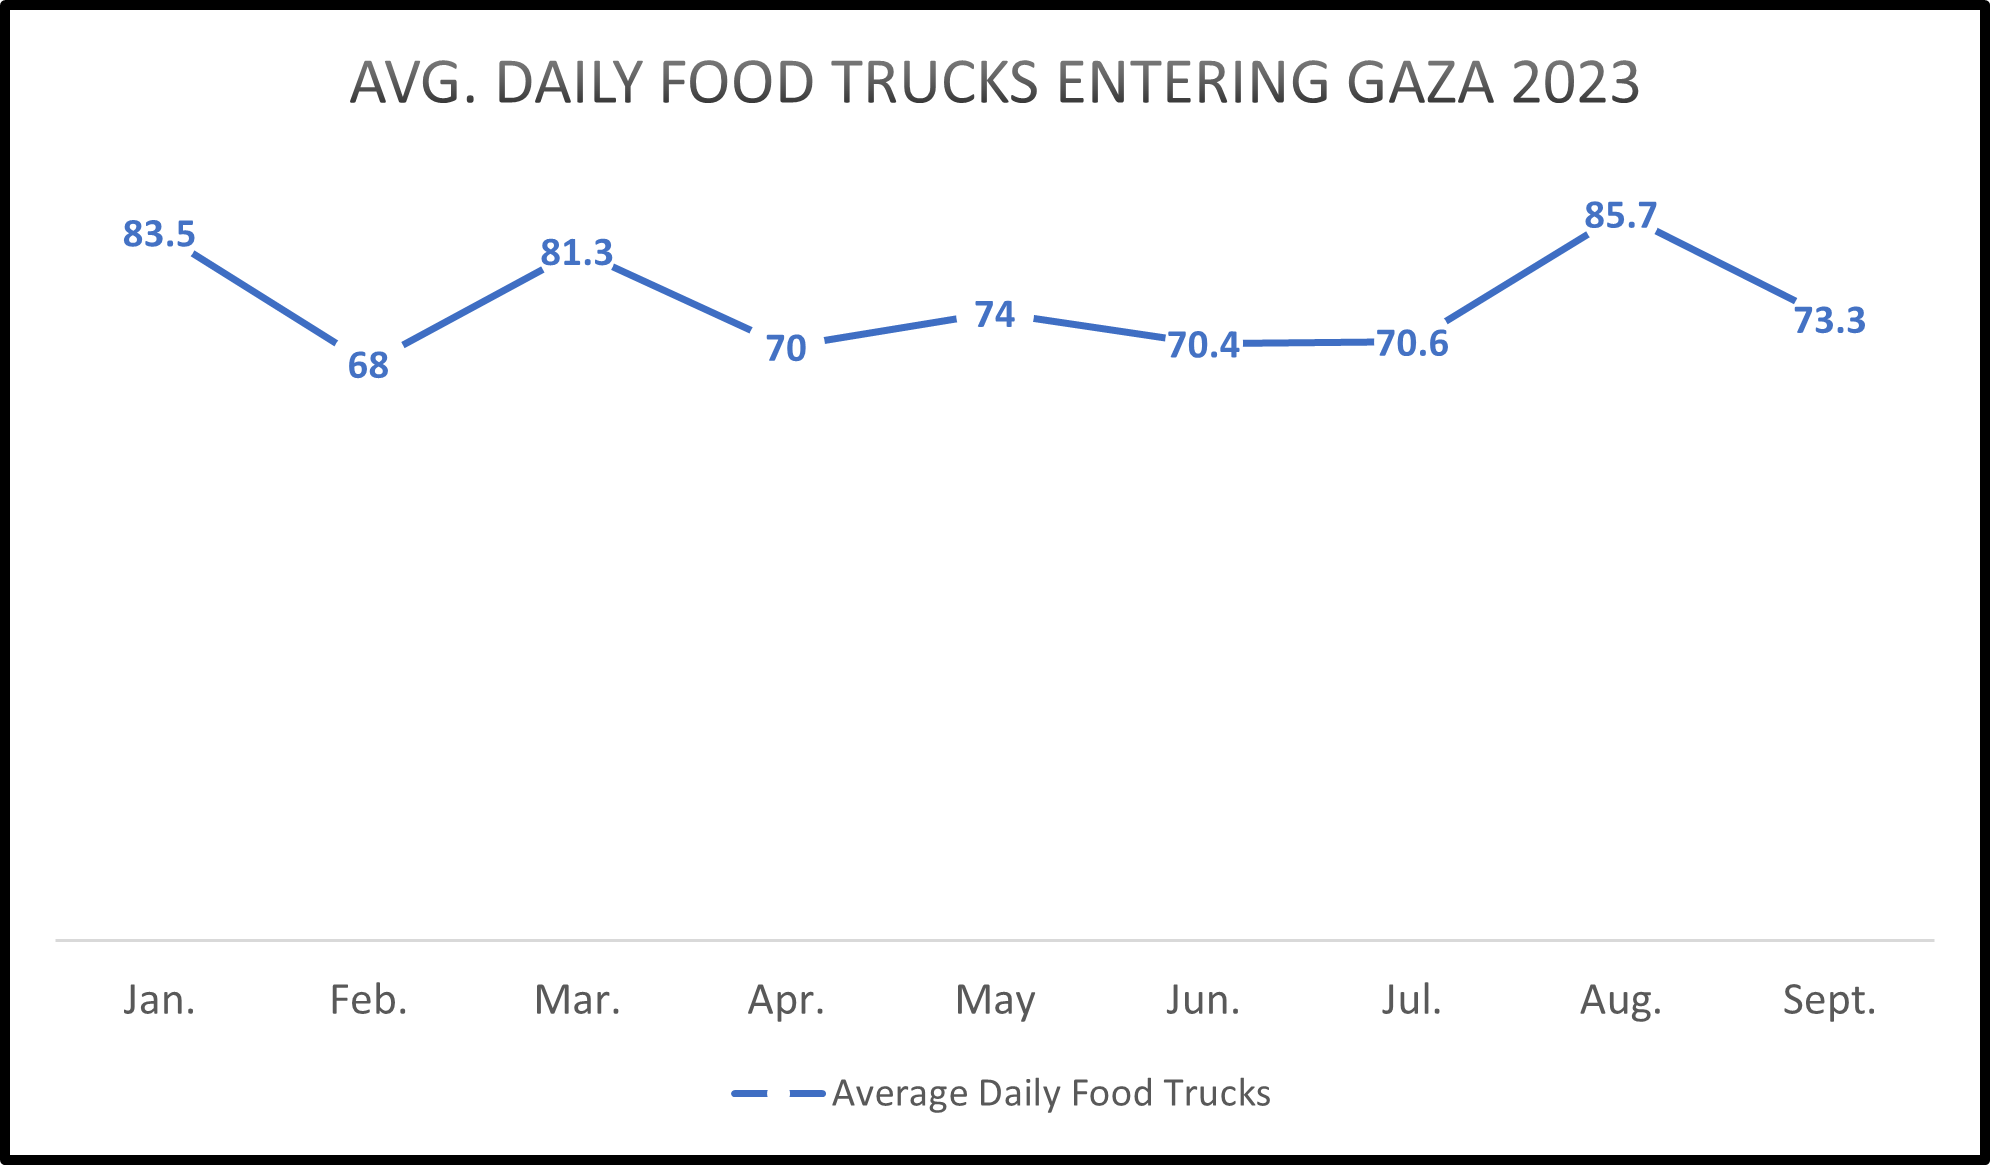
At no point does the daily average come anywhere near the figure provided by CNN. Even if CNN and IPC had included the OCHA categories of “animal feed,” “livestock,” and “raw agricultural products” in their calculations, the daily average rises only to 105.5 trucks per day, still far short of CNN’s figure of 150.
CAMERA is not the only one to have noticed the lack of evidence for the figure of 150. Israel’s Coordination of Government Activities in the Territories (COGAT) unit similarly challenged this claim, writing in response to the IPC, “It is unclear where the pre-war figure of 150 food trucks per day originates. According to OCHA’s dashboard, between January and September 2023, a total 27,434 trucks carrying food entered Gaza through all crossings, which is a daily average of 100 trucks per day (273 days).”[1]
In short, available UN data contradicts CNN’s claim, and suggests the real figure is half that provided by the network.
Misleading Data for Deliveries During the War
When it comes to the figure CNN provides for the average daily number of trucks bringing food into Gaza after October 7, the problem is one of framing.
The authors introduce the graphic with the language of “The number of trucks entering Gaza daily is…,” which suggests the figure is reflective of the current state. But the graphic is not an accurate portrayal of the current state of things. In fact, the number of trucks bringing food into Gaza on a daily basis is far higher today than it was before the war. The graphic misleads by including the early months of the war, when comparatively little aid was flowing into the Gaza Strip for a variety of reasons. But in determining the current humanitarian situation in the Gaza Strip, what matters isn’t what the figures were in October or November, but what the figures are now.
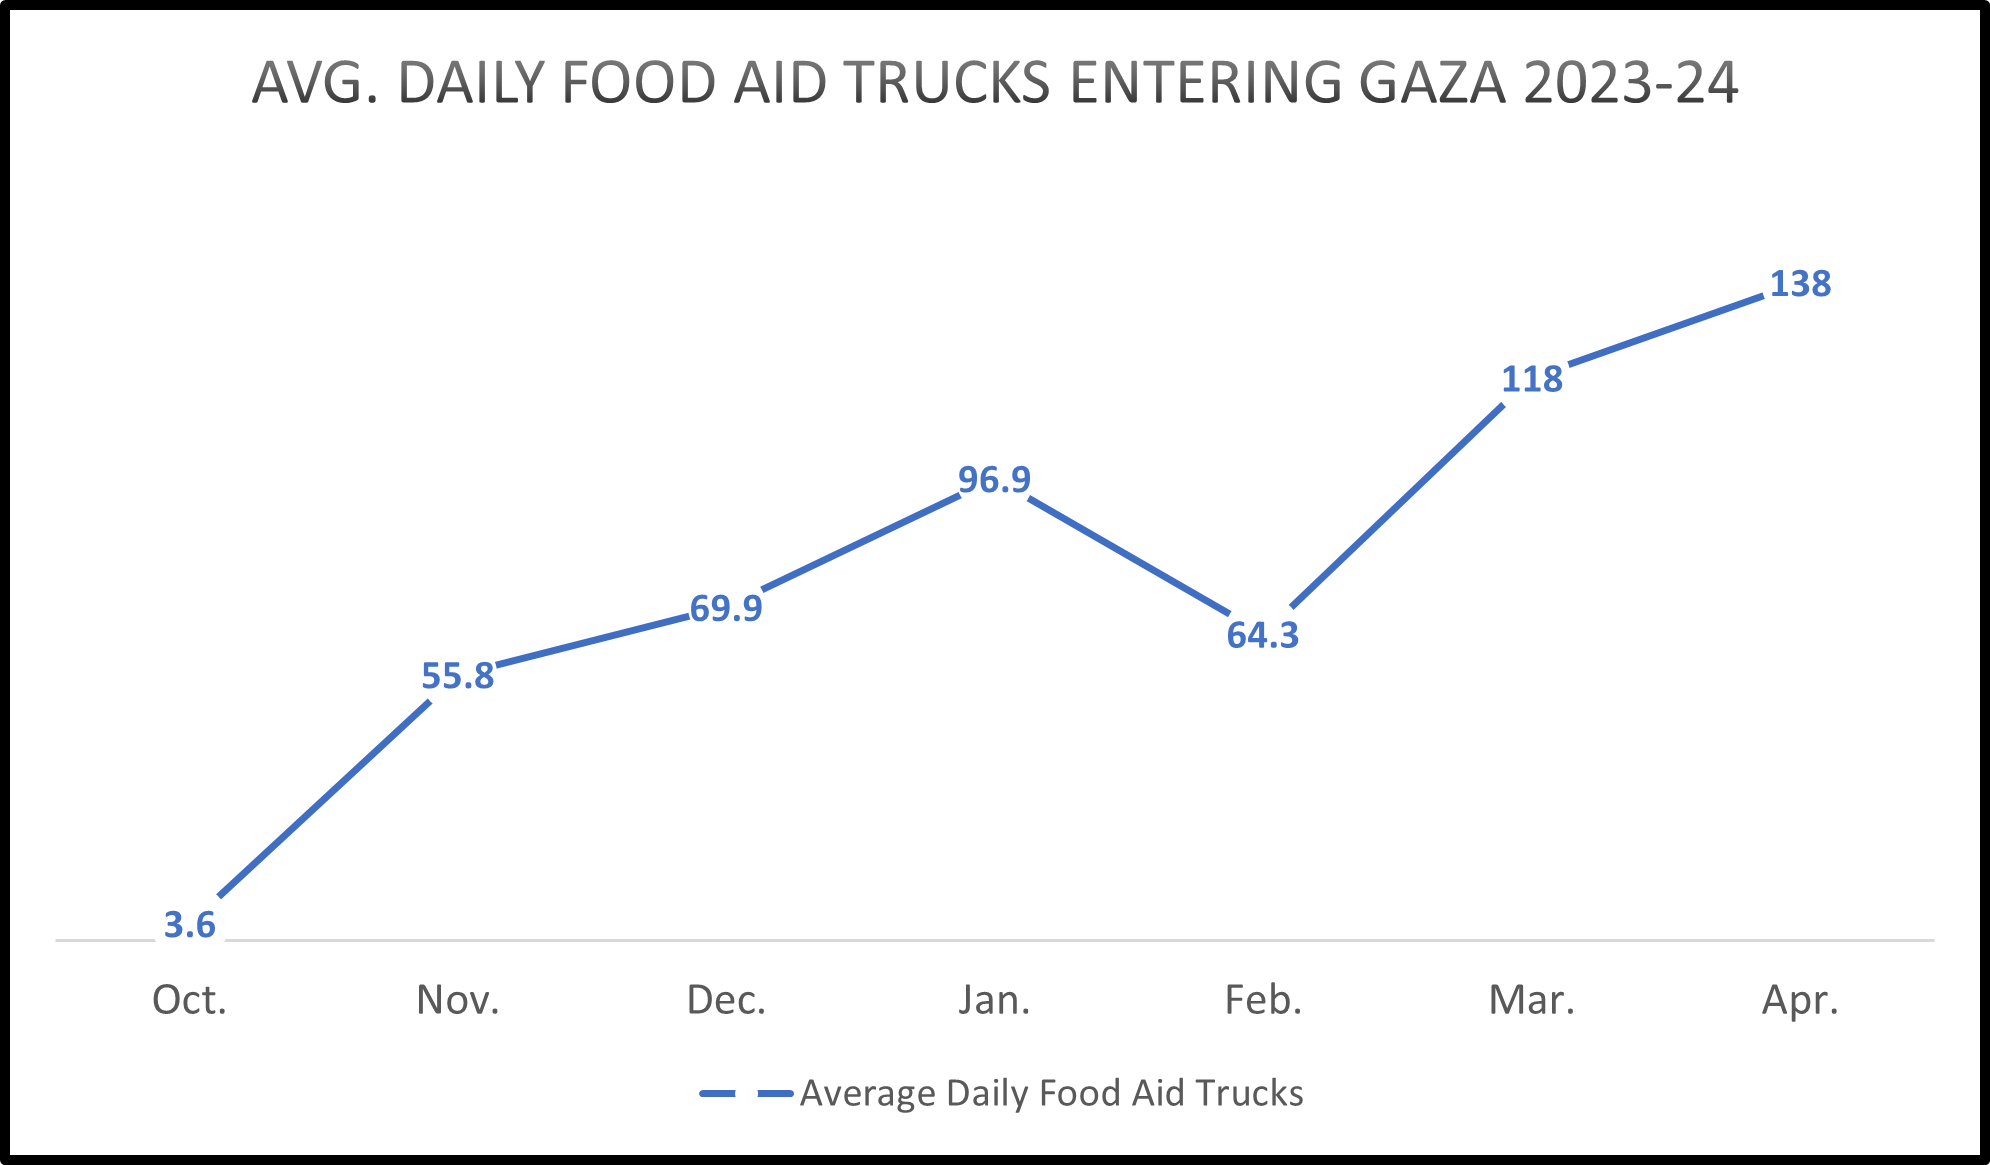
Using data from UNRWA, the current situation looks very different than that portrayed by the CNN graphic. During the months of March and April, the average daily number of trucks bringing food into Gaza is 124.5, a figure 70% higher than that suggested by the CNN graphic. Notably, this data includes only aid brought in by trucks. Given that substantial amounts of humanitarian aid, including food, has been airdropped into Gaza, these figures understate the amount of food entering the territory.
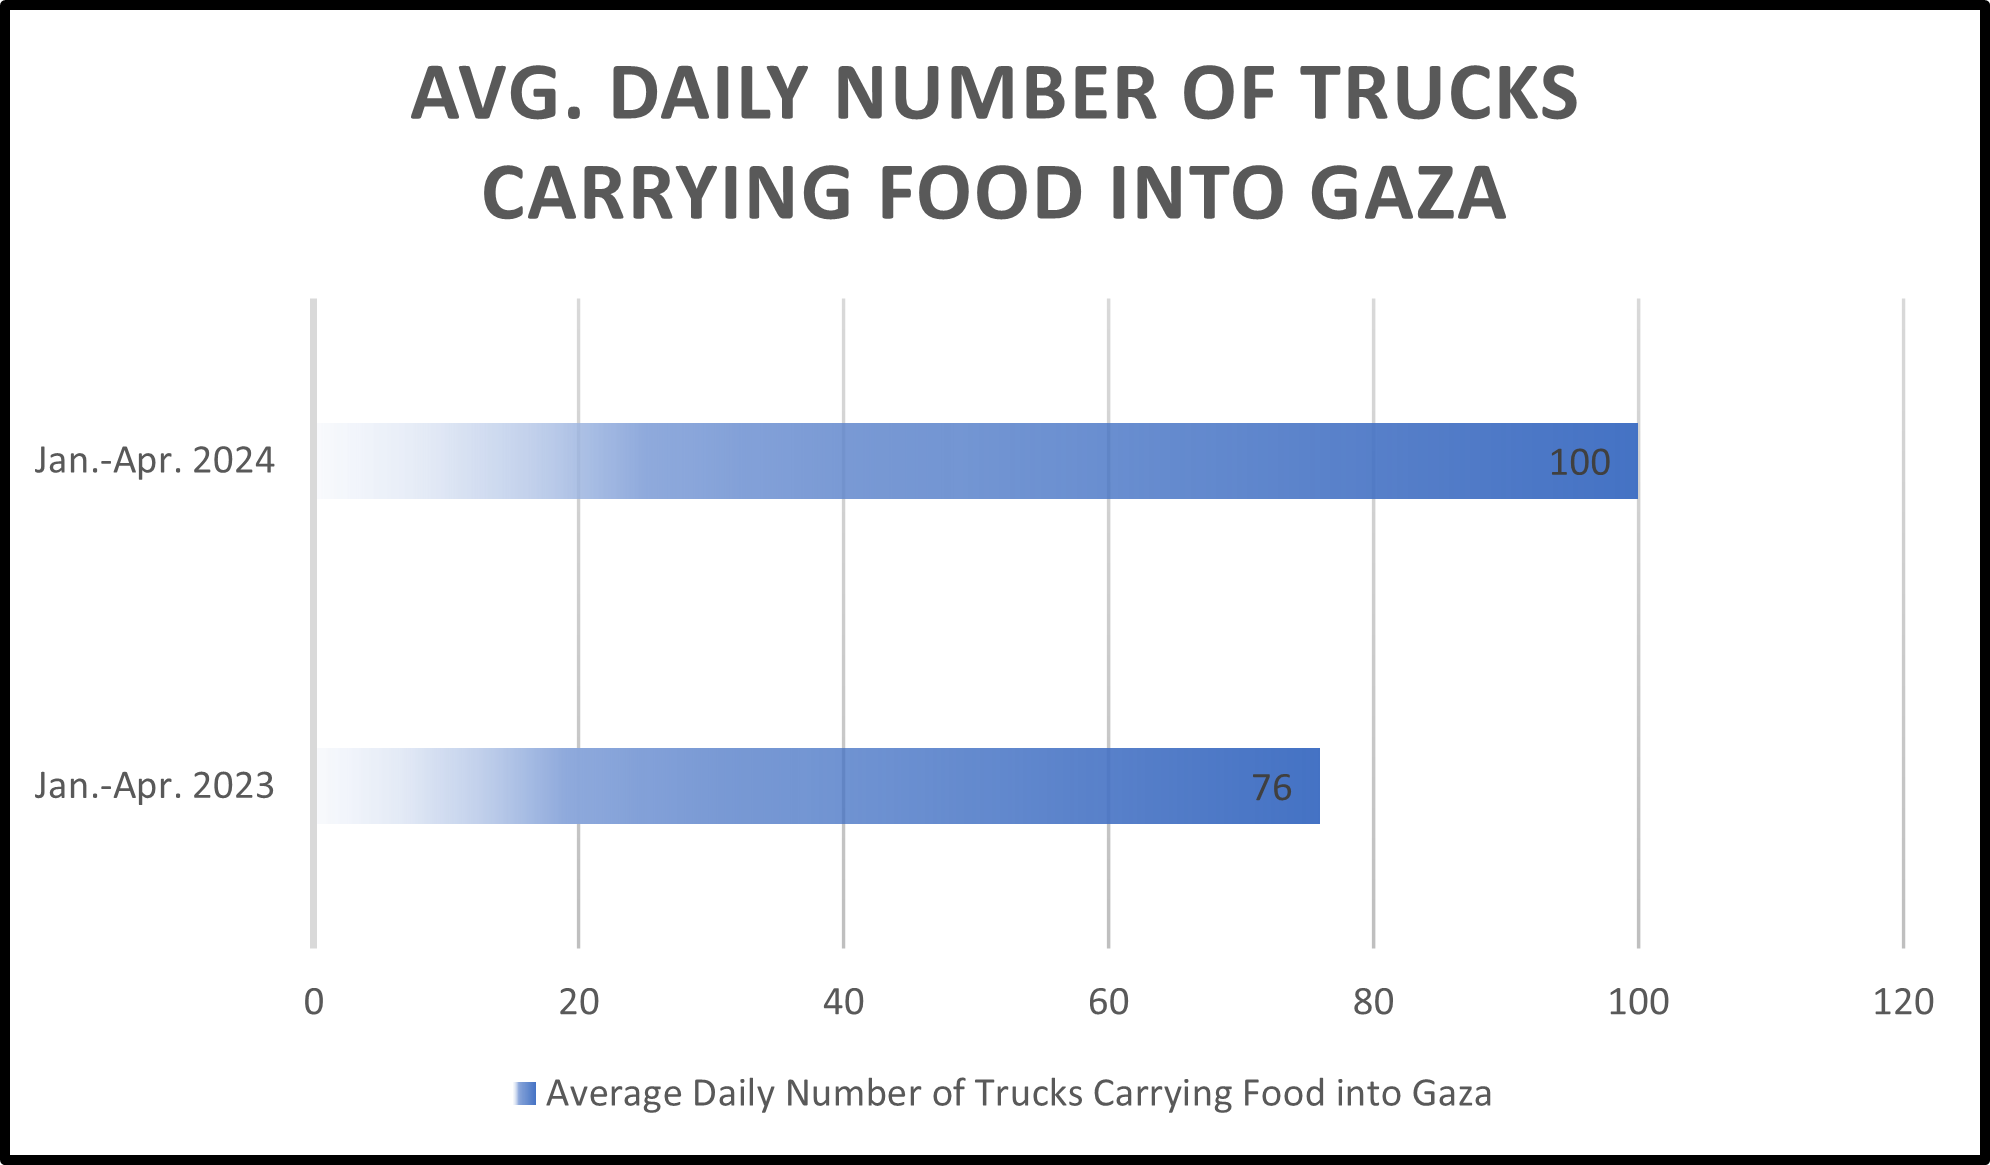
But not only are the current figures higher than the CNN graphic would suggest, they’re also higher than what they were before the war. Consider the chart below, which compares the average daily number of trucks bringing food into Gaza during the first four months of 2023 and 2024.
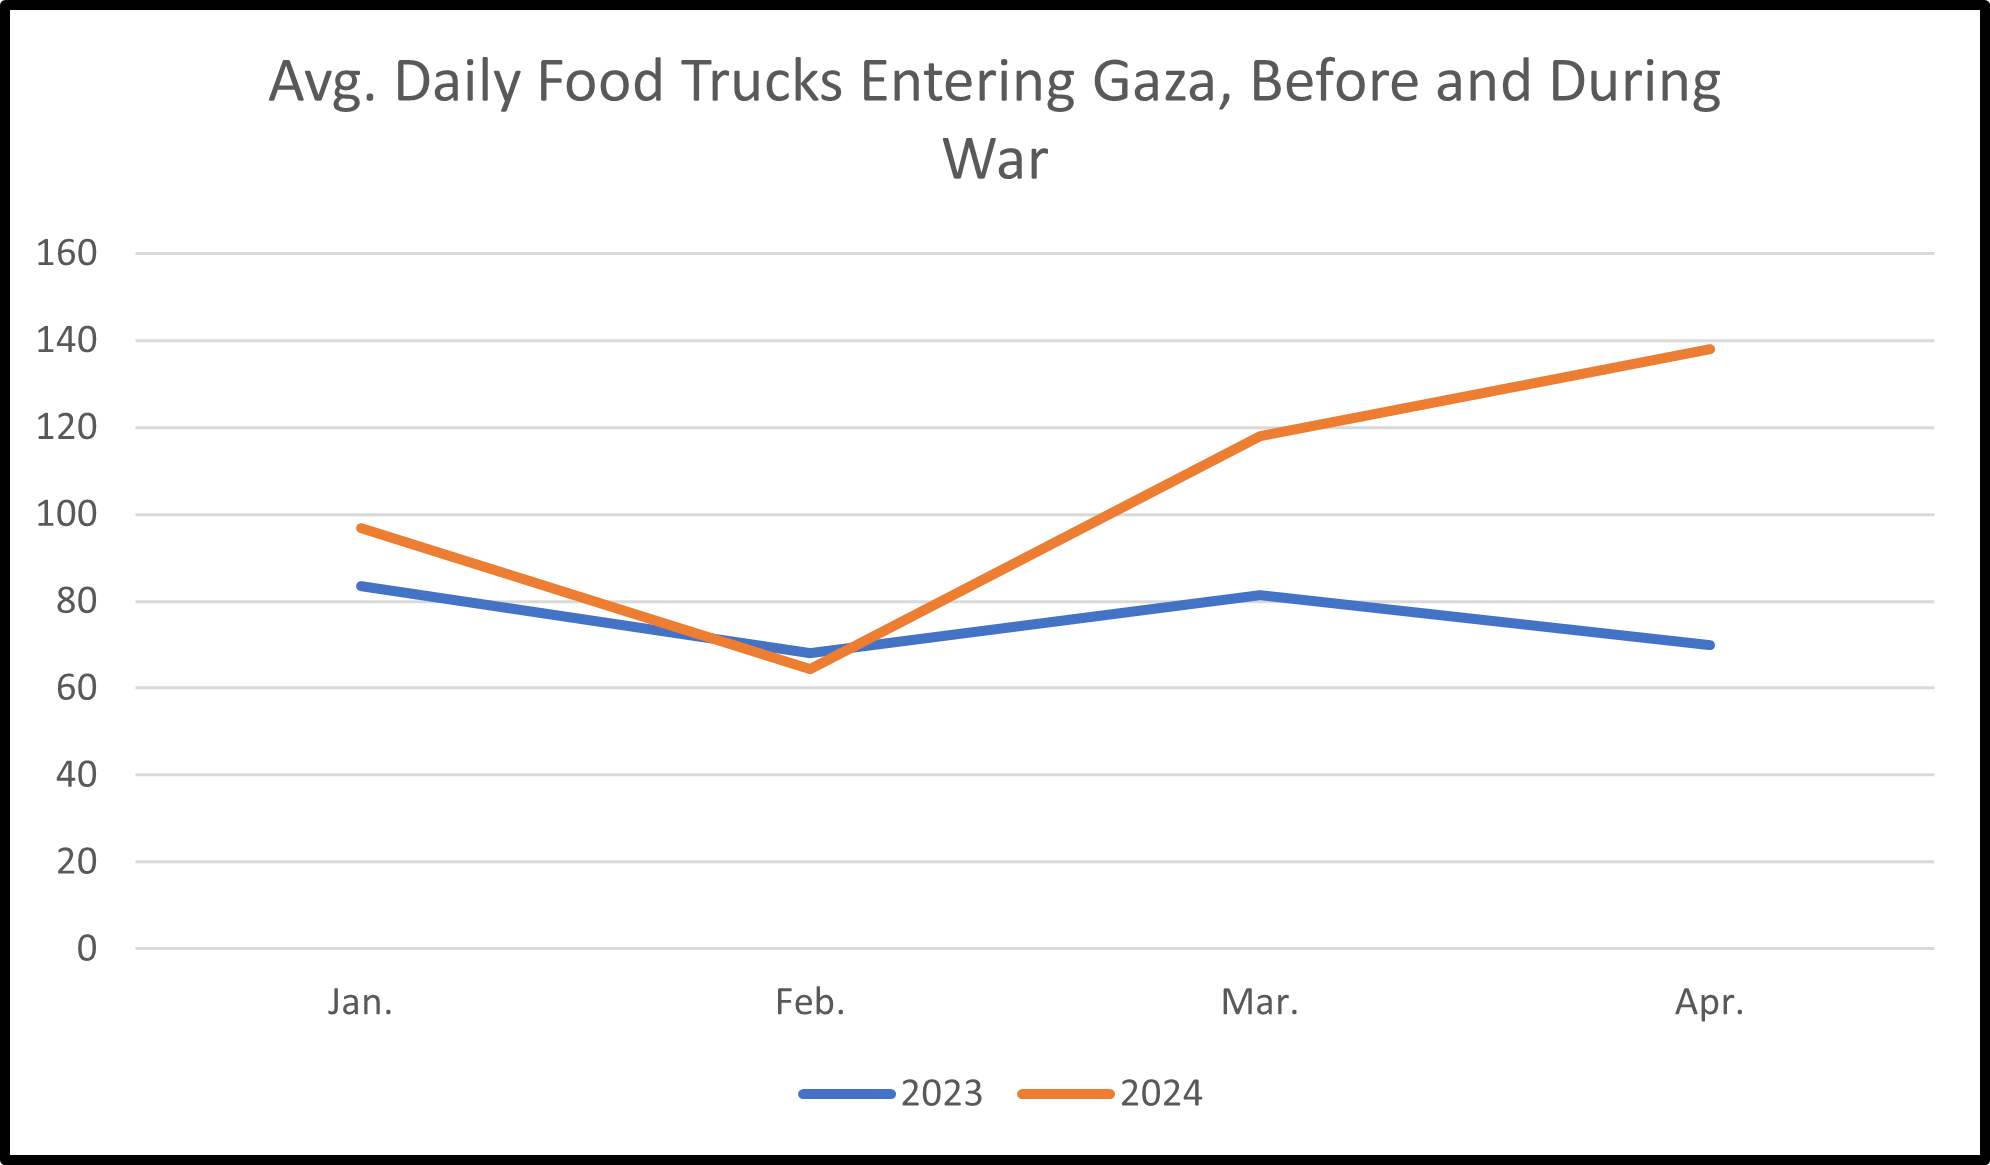
Thus, if one was to recreate CNN’s graphic using a more honest, accurate set of data, it would present the audience with a much different picture, that the delivery of food into Gaza is actually scaling up to reach levels significantly higher than during peacetime.
CNN owes its audience an accurate portrayal of the facts on the ground. Unfortunately, in this case, CNN failed to provide one.
[1] The figure is approximately the same as the figure produced by this author based on the OCHA dashboard if all the following categories are included: human food products; animal feed; livestock; and raw agricultural goods.